- Share
- Decrease font
- Increase font
- Send a friend
-
Click here to bookmark this page
My Bookmarks
×Customize your Bookmarks:
- Type the name of the page the way you would like it to appear in "My Bookmarks";
- Click in the "Add as My Bookmarks" button.
To choose your favorite sessions, please click here.
Main Results
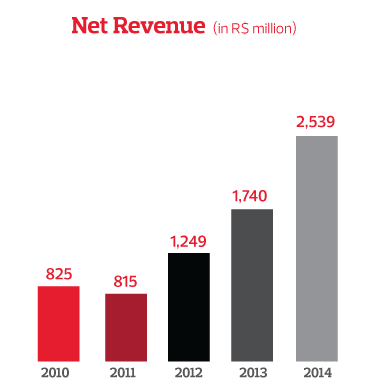
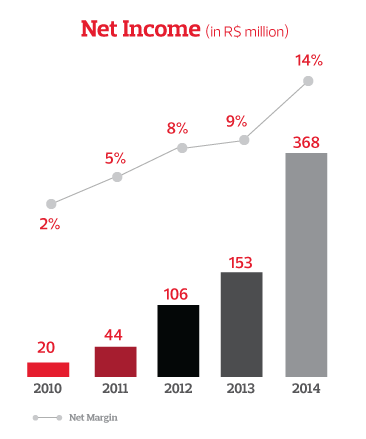
In 2014 accumulated net income increased 45.1% in relation to 2013, from R$105.8 million (8.55% of net revenue) to R$153.4 million (8.8% of net revenue).
Business Performance
Main Results
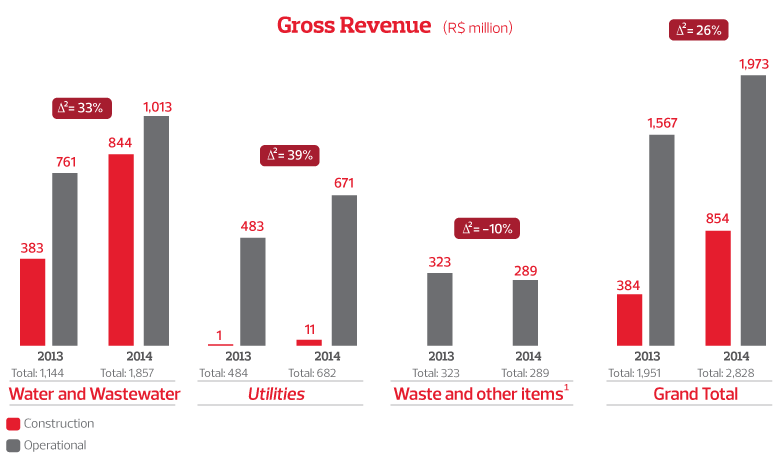
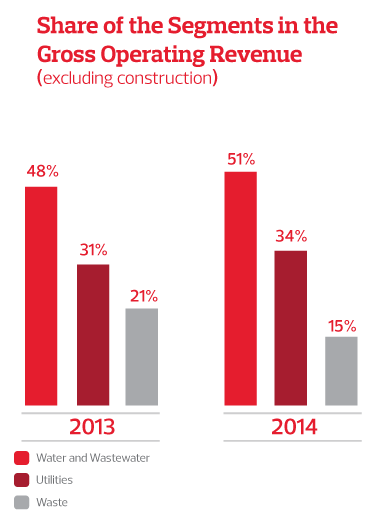
Total gross revenue in 2014 totaled R$2.8 billion. Operating revenue from the three segments, excluding construction revenue, totaled R$2.0 billion, in comparison with the R$1.6 billion registered in 2013, marking growth of 26%. The contracts signed are long term, with sufficient organic growth potential to forecast even greater growth in the coming years. The expansion of the network of assets in the Water and Wastewater segment, the operation of Aquapolo and the increase in business at Cetrel, at Distribuidora de Águas Camaçari and at Distribuidora de Águas Triunfo and in the two projects from the Waste segment back up these expectations.
1Waste segment includes other revenue from the parent company, such as the leasing of machinery and equipment, as well as revenue from ASA.
2Growth of Gross Operating Revenue
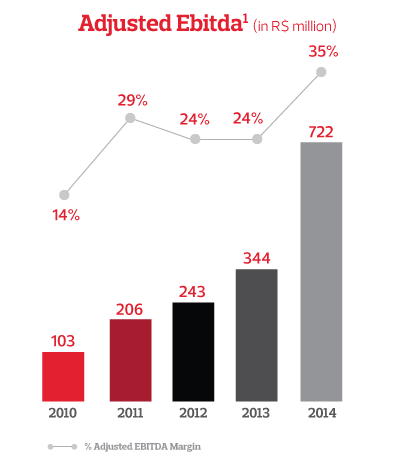
¹ EBITDA is a non-accounting measure prepared by the Company, calculated in accordance with CVM Instruction 527/2012,consisting of net income plus taxes on income, net financial income, depreciation and amortization, while adjusted EBITDA is calculated excluding construction revenue of intangible assets, in accordance with ICPC-01. Although construction revenue from intangible assets has no immediate cash effect, it generates implications in the fiscal year where it is recognized. The adjusted EBITDA margin is calculated as a percentage of net revenue, excluding construction revenue from intangible assets.
Odebrecht Ambiental constantly reassesses its capital structure to ensure the greatest possible value generation for its Shareholders, associated with the lowest possible financial cost. In 2014, the Company recorded R$439 million in cash and restricted funds and registered a net debt of R$3.0 billion and a net worth of R$2.7 billion. The quality of its lines of financing allow the Company to maximize its growth without compromising its strong financial health or Shareholder capital.
Most of the operations are long term, financed through entities committed to the development of the sanitation sector in Brazil, such as CAIXA. More than 90% of the debt operations are structured and directly related to projects, combining the generation of cash from assets with the payment of amortizations and with long terms, on average 9.7 years.
In April 2011, Odebrecht Ambiental hired Fitch Ratings to evaluate the long-term national rating in local currency. At that time, the Company was rated BBB+. In line with the evolution of the business, the rating increased to A (bra) in early 2013, where it has remained to this day.
| Value Added Statement in R$ million | 2011 | 2012 | 2013 | 2014 |
| 1 − REVENUE | 898.2 | 1,395.6 | 1,965.3 | 3,096.30 |
| 1.1) Sale of goods, products and services | 897.2 | 1,374.9 | 1,920.3 | 2,809.40 |
| 1.2) Provision for doubtful accounts – reversal/constitution | -3.5 | 1.3 | -1.4 | -13.1 |
| 1.3) Non-operating | 4.5 | 19.4 | 46.4 | 300 |
| 2 – RAW MATERIALS ACQUIRED FROM THIRD PARTIES (includes the ICMS and IPI taxes) | 399.2 | 662.3 | 878.4 | 1,429.24 |
| 2.1) Raw materials consumed | - | - | - | - |
| 2.2) Cost of goods and services sold | 324.9 | 530.6 | 690.9 | 869.4 |
| 2.3) Materials, energy, third party services and other | 74.3 | 131.7 | 187.5 | 559.84 |
| 2.4) Loss/recovery of assets | - | - | - | - |
| 3 – GROSS ADDED VALUE | 499 | 733.3 | 1,086.9 | 1,667.06 |
| 4 – WITHHOLDING | 41.7 | 78.3 | 141.7 | 170.2 |
| 4.1) Depreciation, amortization and depletion | 41.7 | 78.3 | 141.7 | 170.2 |
| 5 – NET VALUE ADDED PRODUCED BY THE ENTITY | 457.3 | 655 | 945.2 | 1,496.86 |
| 6 – VALUE ADDED RECEIVED IN TRANSFER | 43.5 | 43.3 | 36.8 | 68.7 |
| 6.1) Equity accounting result | -0.3 | 10.6 | -12.9 | -5 |
| 6.2) Financial revenue | 43.8 | 32.7 | 49.7 | 73.7 |
| 7 – TOTAL VALUE ADDED FOR DISTRIBUTION | 500.8 | 698.3 | 982 | 1,565.56 |
| 8 – DISTRIBUTION OF VALUE ADDED* | 500.8 | 698.3 | 982 | 1,565.56 |
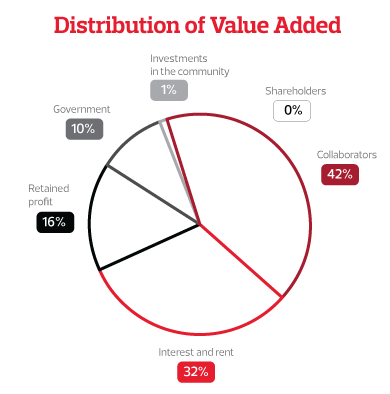
| 8.1) Personnel and charges | 151.2 | 265.2 | 409 | 474 |
| 8.2) Taxes and contributions | 131.2 | 99.7 | 100.6 | 265.7 |
| 8.3) Interest and rentals | 164.2 | 224.1 | 314.1 | 453 |
| 8.4) Interest on equity and dividends | - | - | - | - |
| 8.5) Retained earnings / loss for the year | 52.6 | 105.7 | 153.3 | 367.6 |
| 8.6) Investments in the community | 1.6 | 3.6 | 5.0 | 5.26 |