
- Decrease font
- Increase font
-
Click here to bookmark this page
My Bookmarks
×Customize your Bookmarks:
- Type the name of the page the way you would like it to appear in "My Bookmarks";
- Click in the "Add as My Bookmarks" button.
To choose your favorite sessions, please click here.
- Send a friend
Sustainable performance:
a crucial basis of support
Environmental responsibility
Effluents and waste
Waste management is one of the key aspects of International Paper’s global sustainability goals. Correct disposal is reflected in the reduced amount of waste sent to landfills and for composting and in the generation of energy.
The main waste generated by IP Latin America’s operations comes from industrial processes, including the sludge from liquid effluent treatment systems, ash from burning biomass, and eucalyptus chips from pulp and paper production. The Company has specific indicators for the generation and disposal of this type of waste and adopts a series of preventive measures.
In Brazil, only inert materials are disposed of in landfills. The Company has developed a project in association with CETESB (the São Paulo State Environmental Agency) to dispose of organic waste generated, which today is considered as a by-product and is used for composting, a process through which waste from pulp production—after treatment—is applied to the soil in the company’s eucalyptus forests as fertilizer. The goal is to use this waste generated for other types of planation also.
The Company has specific goals in regard to reducing the generation of liquid effluents, especially related to water quality, and it also monitors biochemical oxygen demand (BOD) levels in the mills.
Non-industrial waste from offices and restaurants is dealt with by service-providers under the Company’s supervision.
Awareness is raised among industrial and administrative personnel, who collaborate in the selective collection process, sorting the waste at the time of disposal. To reduce potential risks arising from waste management, companies that receive recyclable materials must present environmental certifications and permits and submit to audits by IP Latin America every six months in order to verify the final disposal of materials, as well as their practices and their current standing with the environmental agencies.
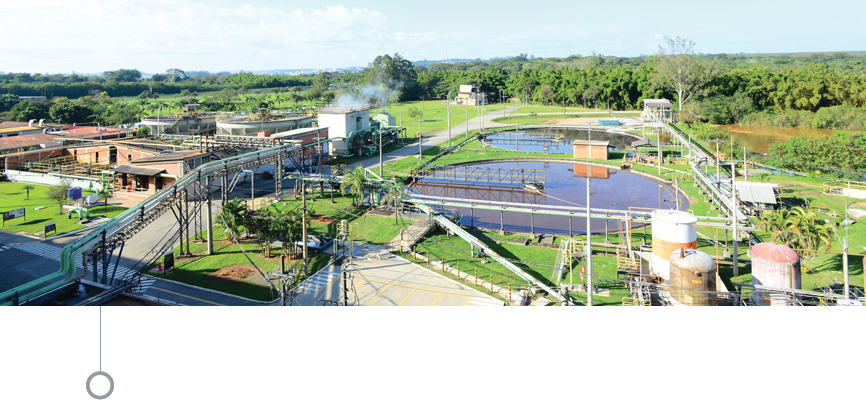
Effluent treatment
Effluents from the Mogi Guaçu and Luiz Antônio units are sent to IP’s treatment mills.
- Total water discharge by quality and destination
- Total weight of waste by type and disposal method (in tons)
Total water discharge by quality and destination
[G4-EN22]
| 2013 | Characteristics of effluent disposal | Unit | Mogi Guaçu | Luiz Antônio | Três Lagoas | Total |
| Volume (m³/year) | m³/year | 20,536,879 | 21,654,403 | 5,398,643 | 47,589,925 | |
| COD | kg/year | 3,579,131 | 3,592,482 | - | 7,171,613 | |
| BOD | kg/year | 119,421 | 324,434 | - | 443,855 | |
| N | kg/year | 9,469 | 107,118 | - | 116,587 | |
| P | kg/year | 12,106 | 4,698 | - | 16,805 |
Previous years (2011 and 2012)
| 2011 | Characteristics of effluent disposal | Mogi Guaçu | Luiz Antônio | Três Lagoas | Total |
| Volume (m³/year) | 20,076,268 | 21,071,019 | 5,012,755 | 46,160,042 | |
| COD (kg/year) | 3,382,851 | 3,731,230 | 193,492 | 7,307,573 | |
| BOD (kg/year) | 97,108 | 353,224 | - | 450,331 | |
| N (kg/year) | 26,726 | 176,739 | - | 203,465 | |
| P (kg/year) | 13,736 | 16,573 | - | 30,309 |
| 2012 | Characteristics of effluent disposal | Mogi Guaçu | Luiz Antônio | Três Lagoas | Total |
| Volume (m³/year) | 20,895,840 | 22,010,689 | 5,358,834 | 48,265,363 | |
| COD (kg/year) | 3,463,229 | 2,997,767 | 221,856 | 6,682,852 | |
| BOD (kg/year) | 96,547 | 231,751 | - | 328,298 | |
| N (kg/year) | 15,218 | 159,805 | - | 175,023 | |
| P (kg/year) | 11,485 | 7,798 | - | 19,282 |
The Organization uses the activated sludge system to treat effluents.
Effluents from the production of seedlings at the Forestry Unit are also treated at the Mogi Guaçu unit. The water used by the Três Lagoas unit is sent to the pulp mill in the same industrial complex, which also treats the effluents with activated sludge.
LEGEND:
- COD: Chemical Oxygen Demand
- BOD: Biochemical Oxygen Demand
- N: Nitrogen
- P: Phosphorus
Total weight of waste by type and disposal method (in tons)
[G4-EN23]
| Type of Waste Disposal | Industry | |||||
| TOTAL 2011 | TOTAL 2012 | TOTAL 2013 | ||||
| Hazardous | Non-hazardous | Hazardous | Non-hazardous | Hazardous | Non-hazardous | |
| Composting | 0 | 96,088 | 0 | 83,337* | 0 | 89,756 |
| Re-use | 0 | 80 | 0 | 1 | 0 | 7 |
| Recycling | 0 | 13,635 | 0 | 8,550* | 0 | 6,478 |
| Landfill | 0 | 2,154 | 0 | 1,330 | 0 | 448 |
| Others | 14 | 0 | 225 | 0 | 116 | 0 |
| Total | 14 | 111,957 | 225 | 93,218 | 116 | 96,688 |
* The composting and recycling figures for 2012 were subsequently revised and consequently differ from those published in the 2012 Sustainability Report. There were changes to the composting and recycling numbers.
| Type of Waste Disposal | Forestry | |||||
| TOTAL 2011 | TOTAL 2012 | TOTAL 2013 | ||||
| Hazardous | Non-hazardous | Hazardous | Non-hazardous | Hazardous | Non-hazardous | |
| Recycling | 0 | 68.96 | 0 | 131 | 0 | 88.73 |
| Recovery | 6.77 | 0 | 6.5 | 0 | 12.9 | 0 |
| Stored on site | 0 | 0 | 50 | 0 | 12.5 | 0 |
| Total | 6.77 | 68.96 | 56.5 | 131 | 25.4 | 88.73 |
Does not include waste generated by the São Paulo office, which is collected by the office building. This information was obtained from the units' annual inventories of solid waste, invoices and collection certificates.