04DIVERSIFICATION WITH SUSTAINABILITY
ECONOMIC DIMENSION
There are various benefits to society generated by Eternit's activities. It is publicly recognised that fibre cement products containing chrysotile ore play a strategic role in the market, catering to families with a lower purchasing power with a product that is technically efficient and economic. The useful life of fibre cement products, combined with their low cost of installation, means that the material is a good substitute for roofing made of black canvas.
In the subchapters below we cover the initiatives of the Eternit Group in more detail, with respect to the generation of economic activity in areas close to its units.
Comparative analysis of Demonstrated Value Added
DVA (Demonstrated Value Added) shows the capacity for value generation and the way that wealth is distributed, calculated based on the difference between the value of the revenues and the inputs acquired from third parties. This statement of value added permits the economic analysis of the Company, and can serve to help in the calculation of GDP and social indicators.
According to the DVA concept, in 2010 Eternit generated R$ 430.7 million of value added to be distributed, 33.4% higher than in 2009. Most of this amount was distributed to employees and shareholders, in amounts that were respectively 42% and 40% higher than in the previous year. EC1

| STATEMENT OF CONSOLIDATED VALUE ADDED | 2010 | 2009 | VARIATION 2009/2010 | |||
| Revenues | 1,010,679 | 759,675 | 33% | |||
| Sales of merchandise, products and services | 991,302 | 743,393 | 33% | |||
| Other revenues | 8,442 | 8,502 | -1% | |||
| Revenues related to the construction of own assets | 13,188 | 8,843 | 49% | |||
| Provision for bad debts | -2,253 | -1,063 | 112% | |||
| Inputs acquired from third parties | -595,454 | -442,151 | 35% | |||
| Cost of products, merchandise and services sold | -389,845 | -263,156 | 65% | |||
| Materials, energy, outsourced services and others | -192,097 | -200,007 | -4% | |||
| Loss/recovery of asset values | -7,736 | -5,319 | 45% | |||
| Other donations | -5,776 | -669 | 763% | |||
| Gross value added | 415,225 | 317,524 | 31% | |||
| Depreciation, amortisation and exhaustion | -18,154 | -17,991 | 1% | |||
| Net value added produced by the entity | 397,071 | 299,533 | 33% | |||
| Value added received in transfer | 33,617 | 23,245 | 45% | |||
| Equity income result | - | - | - | |||
| Financial revenue | 32,400 | 18,364 | 76% | |||
| Others | 1,217 | 4,881 | -75% | |||
| Yotal value added to be distributed | 430,688 | 322,778 | 33% | |||
| DISTRIBUTION OF VALUE ADDED | 2010 | 2009 | VARIATION 2009/2010 | |||
| Staff | 150,208 | 105,644 | 42% | |||
| Direct remuneration | 94,054 | 67,272 | 40% | |||
| Benefits | 49,539 | 33,147 | 49% | |||
| FGTS | 6,615 | 5,225 | 27% | |||
| Taxes and contributions | 151,060 | 116,937 | 29% | |||
| Federal | 110,047 | 91,751 | 20% | |||
| State | 39,878 | 23,987 | 66% | |||
| Municipal | 1,135 | 1,199 | -5% | |||
| Remuneration of third-party capital | 27,335 | 27,078 | 1% | |||
| Interest | 22,524 | 24,605 | -8% | |||
| Rent | 4,811 | 2,473 | 95% | |||
| Others | - | - | - | |||
| Remuneration of own capital | 102,085 | 73,119 | 40% | |||
| Interest-on-equity | 22,367 | 15,118 | 48% | |||
| Dividends | 58,155 | 40,203 | 45% | |||
| Profit retained | 21,562 | 17,793 | 21% | |||
| Participation of non-controlling shareholders | 1 | 5 | -80% | |||
In the table below, Eternit shows its contribution to the economic development of municipalities where its production units are based, in terms of ICMS tax levied. EC9
| 2010 | 2009 | |||||||||
| Units of the Eternit Group | State | ICMS levied in R$ '000 | Amount of Muncipality Participation Fund - FPM* | ICMS levied in R$ '000 | Amount of Muncipality Participation Fund - FPM* | |||||
| Goiânia plant | Goiás | 9,875 | 152,884 | 6,687 | 115,990 | |||||
| Anápolis plant | Goiás | 4,628 | 42,855 | 4,985 | 32,956 | |||||
| Simões Filho plant | Bahia | 3,397 | 20,996 | 2,163 | 20,997 | |||||
| Rio de Janeiro plant | Rio de Janeiro | 7,720 | 148,637 | 5,233 | 112,505 | |||||
| Colombo plant | Paraná | 5,231 | 42,898 | 2,998 | 35,444 | |||||
| Tégula Atibaia plant | São Paulo | 3,505 | 25,260 | - | - | |||||
| Tégula Içara plant | Santa Catarina | 1,283 | 14,844 | - | - | |||||
| Tégula Camaçari Fábrica | Bahia | 331 | 43,493 | - | - | |||||
| Tégula Frederico Westphalen Fábrica | Rio Grande do Sul | 462 | 9,739 | - | - | |||||
| Tégula Anápolis Fábrica | Goiás | 444 | 42,8545 | - | - | |||||
| Minaçu | Goiás | 19,497 | 9,324 | 13,572 | 9,211 | |||||
| Percentage levied by municipality** | ||||||||||
| Goiânia plant | 6.5% | 5.8% | ||||||||
| Anápolis plant | 10.8% | 15.1% | ||||||||
| Simões Filho plant | 16.2% | 10.3% | ||||||||
| Rio de Janeiro plant | 5.2% | 4.7% | ||||||||
| Colombo plant | 12.2% | 8.5% | ||||||||
| Tégula Atibaia plant | 13.9% | - | ||||||||
| Tégula Içara plant | 8.6% | - | ||||||||
| Tégula Camaçari plant | 0.8% | - | ||||||||
| Tégula Frederico Westphalen plant | 4.7% | - | ||||||||
| Tégula Anápolis plant | 1.0% | - | ||||||||
| Minaçu | 209.1% | 147.3% | ||||||||
(**) This calculation represents the amount of ICMS contributed by each unit to the municipality.
For this calculation, ICMS ST was not considered (ICMS which is directed to other states).
(*) Source: http://www.ibge.gov.br/cidadesat/topwindow.htm?1

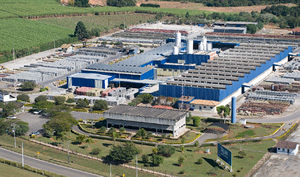
Aerial view of plant at Tégula Atibaia (SP)
As a counterparty to the benefits which are provided to the municipalities where they are based, the plants at Goiânia, Anápolis, Camaçari and Frederico Westphalen all receive tax incentives, which in 2009, totalled R$ 9,994 million compared to R$ 4183 million in 2009. EC4
Eternit's good conduct in its relationship with the government, helps to disseminates the good practices of legislative compliance by all interested parties. Another point worthy of note among the Company's initiatives is the difference between the minimum salaries which it offers, and the local minimum salaries in all regions where the Group operates. The highest salary at Eternit exceeds this amount by 418.7%, as shown in the table below. EC5
| UNIT | LOCAL MINIMUM (R$) | UNIT MINIMUM |
PROPORTION 2010 | PROPORTION 2009 | ||||
| São Paulo Headquarters | 560 | 794.13 | 41.80% | 49.60% | ||||
| Simões Filho plant (BA) | 510 | 704 | 38% | 85.50% | ||||
| Colombo plant and affiliate (PR) | 765 | 842.62 | 10.10% | 21.70% | ||||
| Porto Alegre affiliate (RS) | 510 | 1,500.69 | 194.30% | 203% | ||||
| Osasco office (SP) | 560 | 2,904.50 | 418.70% | 433.20% | ||||
| Rio de Janeiro plant (RJ) | 510 | 653.4 | 28.10% | 48.50% | ||||
| Goiânia plant (GO) | 510 | 577.76 | 13.30% | 16.90% | ||||
| Precon - Anápolis plant (GO) | 510 | 574 | 12.60% | 36.30% | ||||
| SAMA | 510 | 806.32 | 58.10% | 62.10% | ||||
| Atibaia plant (SP) – Tégula | 560 | 920 | 64.30% | - | ||||
| Içara plant (SC) – Tégula | 510 | 787.71 | 54.50% | - | ||||
| Bahia plant (BA) – Tégula | 510 | 530.99 | 4.10% | - | ||||
| Frederico Westphalen affiliate (RS) – Tégula | 510 | 706.2 | 38.50% | - | ||||
| Anápolis office (GO) – Tégula | 510 | 548 | 7.50% | - |