CHECK OUT THE RESULTS
Earnings Release 2013
4Q13 - BRMALLS REPORTS ITS RESULTS FOR THE FOURTH QUARTER OF 2013
BRMALLS REPORTS ITS RESULTS 4Q13
4Q13 Highlights and Subsequent Events:
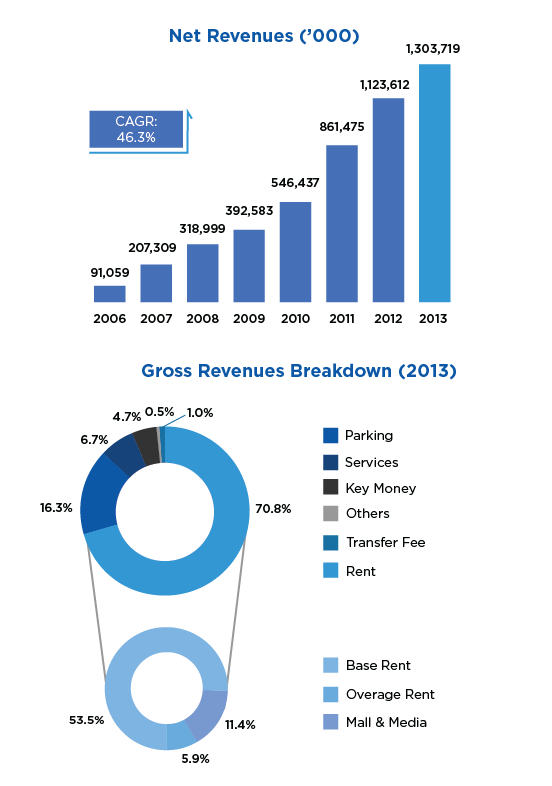
• Net Revenue grew by 11.9% to close 4Q13 at R$375.9 million. In 2013, net revenue was R$1,303.7 million, growing 16.0% from 2012.
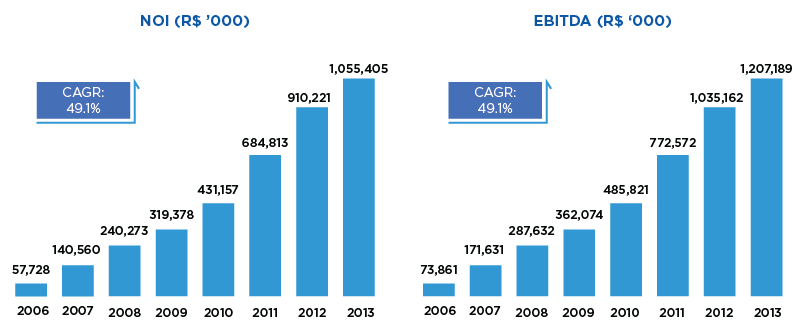
• NOI in 4Q13 was R$353.0 million, increasing 12.0% from 4Q12, with a record-high margin of 92.5% in the quarter. We ended the year with NOI of R$1,207.2 million with a 91.7% margin, growing 16.6% from 2012.
• Adjusted EBITDA was R$323.8 million in the quarter, increasing 21.4% on the year-ago period. Adjusted EBITDA margin stood at 86.1%. We ended 2013 with adjusted EBITDA of R$1,055.4 million, growing 16.0% from 2012. EBITDA margin in 2013 was 81.0%.
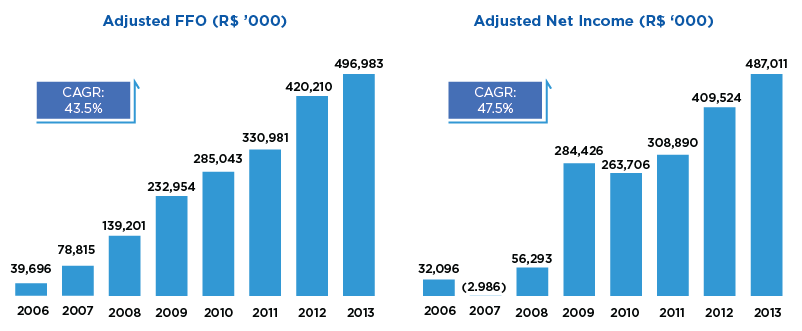
• FFO in the quarter was R$347.6 million. Adjusted FFO was R$149.1 million, growing 22.2% from R$122.0 million in 4Q12. In 2013, adjusted FFO was R$497.0 million, increasing by 18.2% from 2012.
• The effects from the appraisal of our investment properties contributed noncash revenue of R$428.2 million in 4Q13, bringing the amount in the year to R$832.1 million.
• Same-store rent grew by 10.4% in 4Q13 and 9.8% in 2013, while same-store sales grew by 8.0% in 4Q13 and 7.5% in the year.
• The occupancy cost of tenants was 9.7%, the lowest rate in the last 2 years, of which 6.5% was related to rent costs and 3.2% to common and marketing costs. We ended the year with an occupancy cost of 10.4%, of which 6.6% was related to rent costs and 3.8% to common and marketing costs.
• We ended 4Q13 with an occupancy rate of 97.9% in our malls. Of the 52 malls in which we held ownership interests in the fourth quarter, 29 had occupancy rates higher than 99%.
• In 4Q13 we registered a 20.9% Leasing Spread for new contracts and a 33.9% Leasing Spread for contract renewals.
• In October 2013, we launched the expansion of Rio Anil, which added 11.5 thousand m² in total GLA and 5.7 thousand m² in owned GLA to the mall, representing an increase of 43.6% and bringing the mall’s total GLA to 37.8 thousand m². We estimate the project will generate R$6.7 million in stabilized NOI for the company and a real and unleveraged IRR of 21.0%. In December, we opened the expansion of Shopping Sete Lagoas, which added 1,5 thousand m² in total GLA and 1,1 thousand m² in owned GLA to the portfolio of BRMALLS. With this expansion, we expect to generate R$515.0 thousand in Stabilized NOI. The project was opened with a real and unleveraged IRR of 18.1%. The project increased the GLA of Shopping Sete Lagoas by 9.3%.
• In November 2013, we announced the grand opening of Shopping Contagem, which is the company’s 9th greenfield project. With the opening, BRMALLS added another 34.9 thousand m² to total GLA and 17,8 thousand m² to owned GLA. We estimate the project will generate R$22.2 million in stabilized NOI for BRMALLS.
• After 4Q13 we issued a CRI securized debt in the amount of R$403.2 million at rates of IPCA+6.34% (10-year term), IPCA+6.71% (12-year term) and IPCA+7.04% (15-year term).
• After the 4Q13 we sold a 49% stake in Ilha Plaza Shopping for R$120.8 million, with a real IRR of 21.8%. We also sold our total ownership interest in Shopping Pátio Belém for R$45.7 million with a real IRR of 12.8%. After these sales, BRMALLS decreased its owned GLA by 1,4% or 13,332.5 m².
To view the 4Q13 Earnings Report, click here.
3Q13 - BRMALLS REPORTS ITS RESULTS FOR THE THIRD QUARTER OF 2013
BRMALLS REPORTS ITS RESULTS 3Q13
3Q13 Highlights and Subsequent Events:
• Net revenue grew by 15.8% in 3Q13 to R$322.4 million.
• NOI in 3Q13 was R$299.1 million, increasing 16.4% from 3Q12, with margin of 92.2% in the quarter, the biggest margin in BRMALLS history. Same-property NOI grew 12.0% compared to 3Q12.
• Adjusted EBITDA was R$259.0 million this quarter, increasing 16.1% on the year-ago period. Adjusted EBITDA margin stood at 80.3%.
• Adjusted FFO was R$130.9 million, growing 37.4% from R$95.3 million in 3Q12. AFFO margin was 40.6% in 3Q13.
• Adjusted net income in the quarter was R$128.4 million, 32.2% above 3Q12. The adjusted net income margin was 39.8%.
• Same-store rent increased 9.3% in 3Q13, while same-store sales grew 8.1% in the period.
• Store occupancy cost was 10.2%, of which 6.5% was related to rent and 3.7% to common area and marketing costs, in line with our efforts to reduce common costs for tenants and replace them with rent increases, helping to keep tenants healthy while benefiting our growth.
• The occupancy rate of our malls closed the quarter at 97,6% of leased GLA. Of the 51 malls in which we held ownership interests in 3Q13, 24 had occupancy rates higher than 99%.
• Late payments fell by 60 bps from the same period last year to 3.1%. Net payments was 0.5% in 3Q13, reducing 80 bps when comparing to 2Q13 and 40 bps when compared to 3Q12, which demonstrates our operational efficiency and efforts to reduce delinquency rates.
• The investment property for the expansion of Natal Shopping contributed with a non-cash operational revenue of R$55.8 million in 3Q13.
• In 3Q13, we renegotiated more than R$435.2 million of our debt, reducing the average interest rate from TR +11.16% to TR +9.80% and increasing the total amount refinanced since 2H12 to R$2.1 billion. The NPV generated by this negotiation was R$18.0 milion.
• On September 13th, we opened the expansion of Natal Shopping, which added 9.5 thousand m² and 4.8 thousand m² of total and owned GLA to the mall, respectively. We estimate the project will generate R$9.5 million in stabilized NOI for the company and a real and unleveraged IRR of 18%.
• On October 31st, we opened the expansion of Rio Anil Shopping, which added 11.5 thousand m² and 5.7 thousand m² of total and owned GLA to the mall, respectively. We estimate the project will generate R$6.7 million in stabilized NOI for the company and a real and unleveraged IRR of 21.0%.
• After the 3Q13 we announced four expansions: Capim Dourado, Sete Lagoas, Recife and NorteShopping.
To view the 3Q13 Earnings Report, click here.
2Q13 - BRMALLS REPORTS ITS RESULTS FOR THE SECOND QUARTER OF 2013
BRMALLS REPORTS ITS RESULTS 2Q13
2Q13 Highlights and Subsequent Events:
• In the second quarter of 2013 net revenue was R$315.3 million, increasing 18.6% from the same quarter of 2012.
• NOI in 2Q13 totaled R$290.3 million, increasing 18.5% from 2Q212, with a margin of 91.4% in the quarter. Same-property NOI grew 12.8% compared to 2Q12.
• Adjusted EBITDA was R$250.3 million this quarter, increasing 15.3% on the year-ago period. Adjusted EBITDA margin stood at 79.4%.
• In 2Q13, the adjusted Net Income registered R$122.6 million, a 11.3% growth on top of R$110.1 million registered in the 2Q12.
• FFO in the quarter was R$187.1 million. Adjusted FFO was R$125.1 million, growing 10.7% from R$113.0 million in 2Q12.
• Recognition of investment properties led to a non-cash gain of R$348.1 million in 2Q13, which increased the total value of our investment properties to R$16.7 billion.
• Exchange variation in 2Q13 generated a non-cash net financial expense of R$92.8 million on the principal of our perpetual bond.
• Same-store rent increased 8.3% in 2Q13, while same-store sales grew 6.2%.
• The occupancy cost was 10.5%, a decrease of 0.2% when compared to the 2Q12, which 6.5% was related to rent and 4.0% to condominium and marketing costs, in line with our efforts to reduce condominium costs for tenants.
• The occupancy rate of our malls closed the quarter at 97.7% of leased GLA, an increase of 0.1% from 2Q12. Of the 51 malls in which we held ownership interests in 2Q13, 23 had occupancy rates higher than 99%.
• Late payments fell by 0.4 p.p. from the same period last year totaling 3.6%.
• On May 5th, we opened the expansion of Plaza Niterói, which added 10,500 m² of total and owned GLA to the mall, increasing the area in 31.3%. We estimate the project will generate R$26.0 million in stabilized NOI for the company and a real and unleveraged IRR of 18.6%.
• On May 8th, we announced the approval of a share buyback plan for the repurchase of shares issued by the Company. Up to 22,852,866 common shares may be acquired, which represented 5% of the free-float, on the day of the announcement.
• In 2Q13, we refinanced more than R$231.3 million of our debt, reducing the average interest rate of these debts from TR+10.7% to TR+9.33%, and increasing the total amount refinanced since 2H12 more than R$1.7 billion. The NPV of the new liability management was R$11 million.
• During this quarter, we issued 40,000 debentures, totaling the amount of R$400 million. This funding has duration of 3 years and a rate of CDI + 0.62%.
To view the 2Q13 Earnings Report, click here.
1Q13 - BRMALLS REPORTS ITS RESULTS FOR THE FIRST QUARTER OF 2013
BRMALLS REPORTS ITS RESULTS 1Q13
1Q13 Highlights and Subsequent Events:
• In the first quarter of 2013 net revenue was R$290.0 million, increasing by 19.1% from the same quarter of 2012.
• NOI was R$264.8 million in 1Q13, increasing 21.6% from 1Q12. NOI margin in the period was 90.3%.
• In 1Q13, adjusted EBITDA grew by 9.3%, compared to the same quarter of 2012, reaching R$222.3 million. Excluding the nonrecurring gains from selling Shopping Pantanal in 1Q12, adjusted EBITDA grew in the quarter 17.7%. Adjusted EBITDA margin in the quarter was 76.6%.
• Adjusted FFO grew by 1.9% from 1Q12 to reach R$91.9 million in the quarter. Excluding the nonrecurring gains related to the sale of Shopping Pantanal in 1Q12, Adjusted FFO in the quarter grew by 14.1%. AFFO margin reached 31.7% in 1Q13.
• Total sales in the shopping malls of BRMALLS totaled to R$4.6 billion in the first quarter of 2013, increasing by 14.0% from the same period of 2012.
• We continue to register strong performance in same store rent, which grew by 11.1% in 1Q13 and has presented a consistent improvement over the last 4 quarters. Same store sales grew by 7.5% from the strong comparison base of 1Q12.
• In 1Q13, we registered a strong leasing spread for contract renewals of 21.1% and a leasing spread for new contracts of 19.3%.
• Occupancy at our malls remained high during 1Q13, with an average occupancy rate of 97.9%, compared to 97.4% in 1Q12. Excluding the malls acquired and opened in the last 12 months, the occupancy rate was 98.1%. In 1Q13, of the 51 malls in which the Company holds interests, 24 had more than 99% of their GLA leased.
• In January 2013, BRMALLS began to manage and lease Natal Shopping, which has 17.4 thousand m² of GLA and is the dominant mall in the city of Natal. The mall was renovated in 2009 and has an expansion project, which should open by 3Q13 and will add 9.7 thousand m² to the mall’s total GLA. With Natal Shopping, the number of managed malls by BRMALLS increased to 42. Natal Shopping is the 4th mall to be managed by the company in the country’s Northeast region.
• The Company lowered the interest rate of the Real Estate Certificates (CRIs) for the acquisition of Shopping Tijuca from TR +10.7%p.a by 0.8p.p, to TR +9.9%p.a. This renegotiation has a positive NPV, net of costs of R$25.0 million. With this renegotiation the Company will add another R$623.2 million to the amount of debt renegotiated, for a total of more than R$1.4 billion in liability management since 2012.
• On April, 2013, 40,000 registered, book-entry, non-convertible debentures of BRMALLS were issued in the total amount of R$400.0 million. The debentures have a term of 3 years as from the issue date and a rate of CDI + 0.62%, in line with our liability management policy.
• In May 2013, we opened Plaza Niteroi expansion. The expansion added 10.5 thousand m² of total and owned GLA to our portfolio. We expect the project to generate R$26.0 million in stabilized NOI for BRMALLS, and an IRR, real and unleveraged, of 18.6%.
To view the 1Q13 Earnings Report, click here.
Operating and Financial Indicators
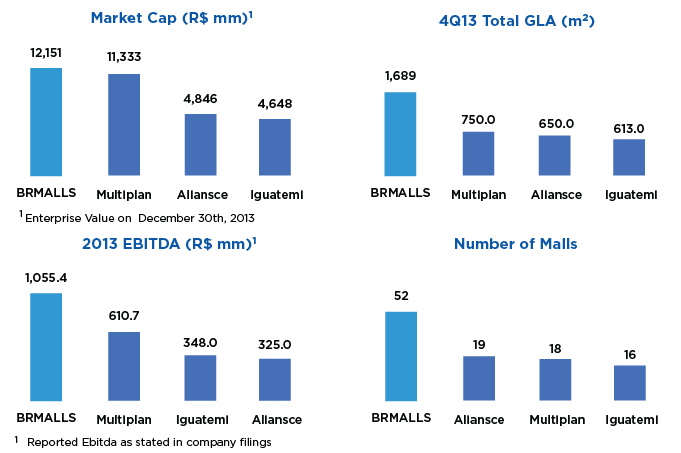
Largest and Best Company in the Sector
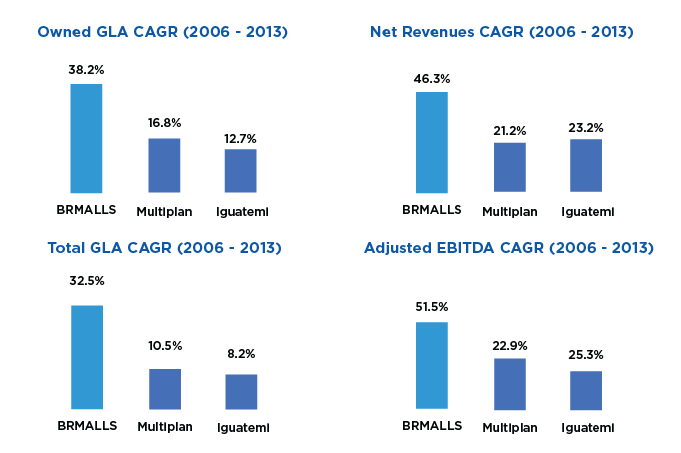
The fastest growing company in the sector with more than twice the average of our competitors
BRMALLS became the most efficient player in the sector
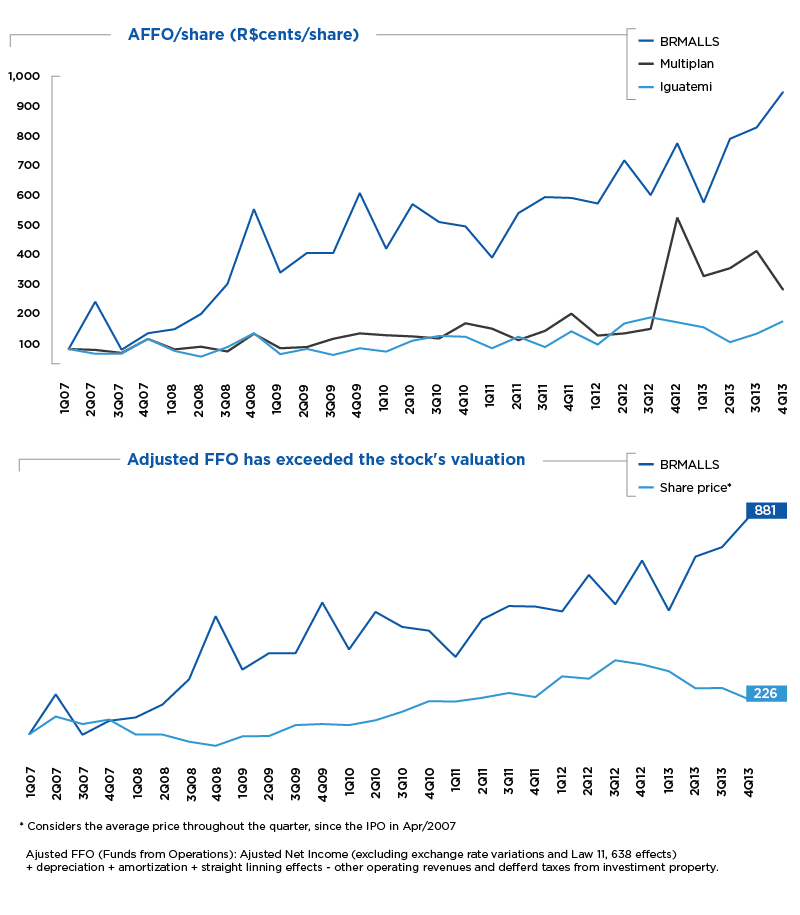
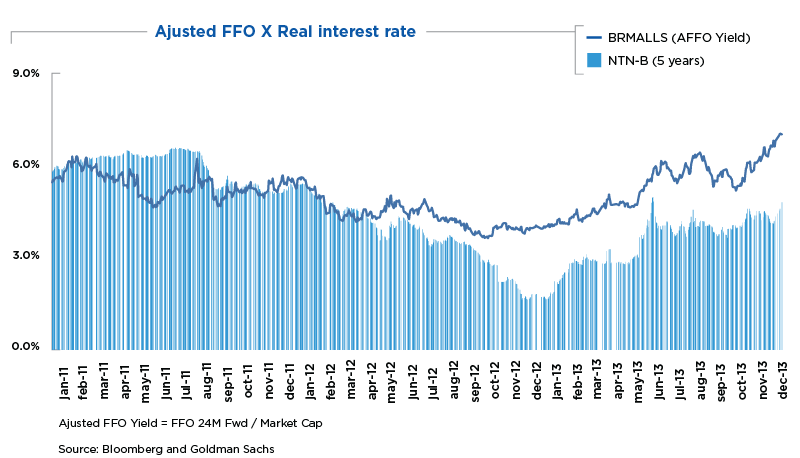
BRMALLS has consistently DELIVERED MORE VALUE to its shareholders
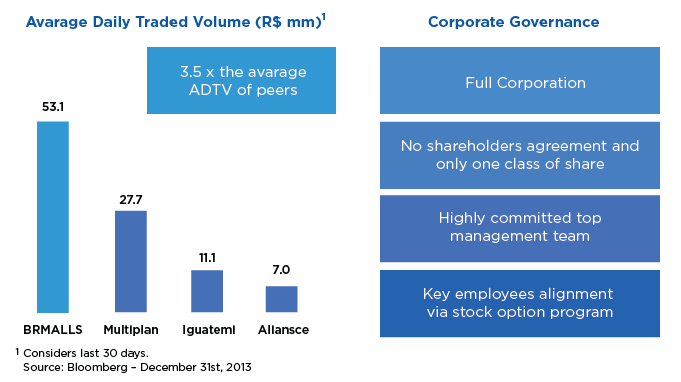
BRMALLS is the company in the sector with the highest corporate governance standards and free-float
Financial Highlights
Glossary
Adjusted EBITDA: EBITDA + Shopping Araguaia profit-sharing debenture revenues – other operating revenues from investment property
Adjusted FFO (Funds From Operations): Adjusted net income (excluding exchange rate variations and Law 11,638 effects) + depreciation + amortization + straight-lining effects – other operating revenues and deferred taxes from investment property
Average GLA (Rent/m² and NOI/m²): Does not include 27,921 m² of GLA from the Convention Center located in Shopping Estação. In the average GLA used for rent/m², we do not consider owned GLA for Araguaia Shopping, since its revenues are recognized via debenture payments.
Acquired Portfolio: Other malls acquired in 2007 and on.
Cash on cash: Stabilized NOI (fourth year after inauguration) over net capex (total Investment – key money revenues).
EBITDA (Earnings Before Interest, Taxes, Depreciation and Amortization): refers to gross income - SG&A + depreciation + amortization.
Gross Leasable Area or GLA: Sum of all areas in a shopping mall that are available for lease, except for kiosks.
Late Payment: Measured on the last day of each month, includes total revenues in that month over total revenues effectively collected in the same month. It does not include inactive stores.
Law 11,638: Law 11,638 was enacted with the purpose of including publicly-held Brazilian companies in the international accounting convergence process. The 4Q08 financial and operating figures will be impacted by certain accounting effects due to the changes arising from Law 11,638/07.
Leasing Spread: Comparison between the average rent for the new contract and the rent charged in the previous contract for the same space.
Leasing Status: GLA that has been approved and/or signed divided by the projects total GLA.
Net Operating Income or NOI: Gross revenue (less service revenue) - costs + depreciation + amortization.
Occupancy Cost as a Percentage of Sales: Rent revenues (minimum rent + % overage) + common charges (excluding specific tenant costs) + merchandising fund contributions. (This item should be analyzed from the tenant’s point of view.)
Occupancy Rate: Total leased and occupied GLA as a percentage of total leasable GLA.
Original Portfolio: Original malls acquired from ECISA (Norte Shopping, Shopping Recife, Villa-Lobos, Del Rey, Campo Grande and Iguatemi Caxias).
Owned GLA: GLA multiplied by our ownership stake.
Same-Property NOI: NOI from the exact same properties in which we currently own a stake, proportional to our ownership stake in the property for both periods.
Same store sale (SSS): Sales figures for the same stores that were operating in the same space in both periods.
Same store rent (SSR): Rent figures for the same stores that were operating at the same space in both periods.
Shopping Malls by Income Group (Brazil Criterion): The Brazil Criterion is related to the purchasing power of individuals and families and is defined by IBOPE. According to this criterion, our malls are divided into four categories:
- Upper: Villa Lobos, Crystal e Fashion Mall;
- Upper-middle: Goiânia, Iguatemi Caxias, Plaza Niterói, Center Shopping Uberlândia, Granja Vianna, Catuaí Londrina, Catuaí Maringá, Mooca, Jardim Sul, Tijuca, Paralela , São Bernardo e Casa e Gourmet;
- Middle: Amazonas, Independência; Campo Grande, Sete Lagoas, Minas, Itaú Power, Estação BH, Plaza Macaé, Londrina Norte, Capim Dourado, Curitiba, Norte Shopping, ABC, Metrô Santa Cruz, Piracicaba, Tamboré, Center Shopping, Ilha Plaza, Del Rey, Belém, Mueller, São Luís, Recife, Natal, e Iguatemi Maceió;
- Lower-middle: Metrô Tatuapé, BIG, Rio Anil, Campinas Shopping, TopShopping, Osasco, Araguaia, Estação, Via Brasil e West.
Tenant Turnover: sum of new contract GLA negotiated in the last 12 months – the GLA variation for unoccupied stores in the last 12 months / average GLA in the last 12 months.


