BR MALLS is THE LARGEST shopping mall company in Latin America:
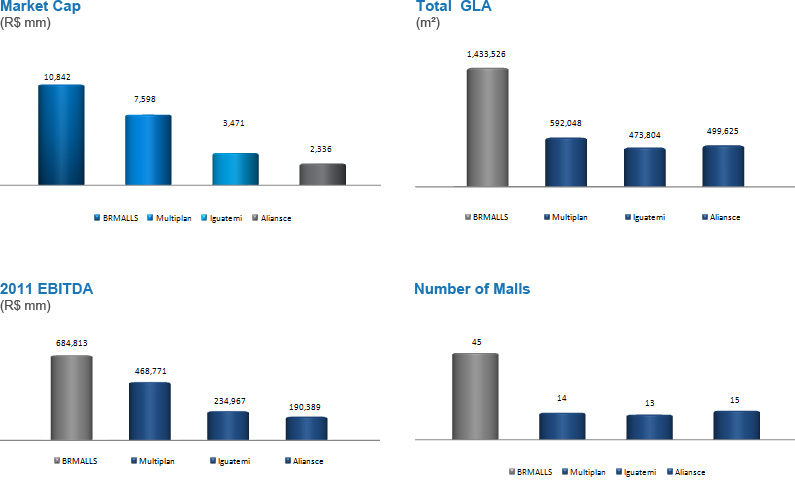
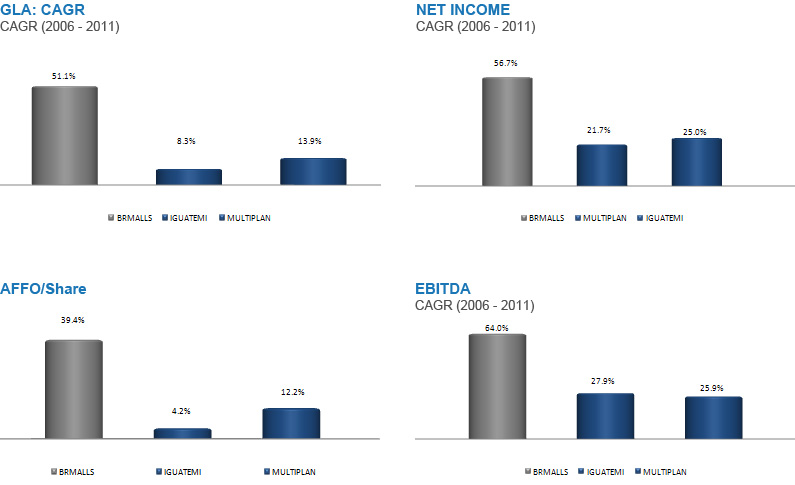
THE FASTEST GROWING company in the sector with more than twice the average of our competitors:
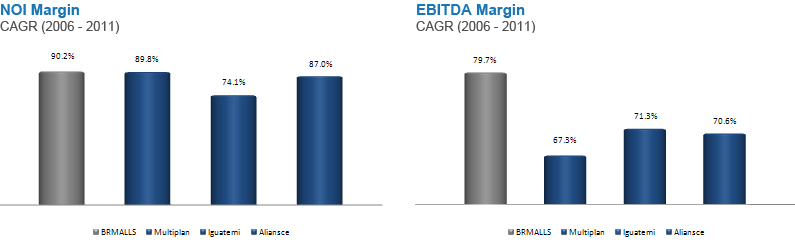
BR MALLS became THE MOST EFFICIENT player in the sector2011:
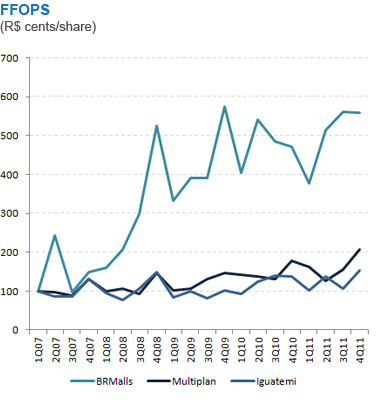
BR Malls has consistently DELIVERED MORE VALUE to its shareholders:
BRMALLS stock has presented the BEST PERFORMANCE in the sector*:
The graph below shows that in all dates BRMALLS stocks had a better performance than peers and the Bovespa index.
| | | Performance since event |
|---|
| Event | Date | BRML3 | IGTA3 | MULT3 | ALSC3 | | Ibovespa |
| | | | | | | |
| Iguatemi IPO | 6-Feb-07 | N/A | 30.4% | N/A | N/A | | 47.5% |
| | | | | | | |
| BRMALLS IPO | 3-Apr-07 | 203.8% | 42.4% | N/A | N/A | | 44,5% |
| | | | | | | |
| Multiplan IPO | 26-Jul-07 | 109.6% | 43.6% | 76.7% | N/A | | 24.2% |
| | | | | | | |
| Gen. Shop. IPO | 26-Jul-07 | 112.0% | 43.6% | 77.4% | N/A | | 24.2% |
| | | | | | | |
| BRMALLS Follow-on | 18-Oct-07 | 91.2% | 56.4% | 71.0% | N/A | | 5,8% |
| | | | | | | |
| BRMALLS Follow-on | 01-jul-09 | 214,8% | 138,0% | 114,1% | N/A | | 29,8% |
| | | | | | | |
| Multiplan Follow-on | 24-Sep-09 | 133.0% | 65.8% | 57.0% | N/A | | 11,4% |
| | | | | | | |
| Iguatemi Follow-on | 22-Oct-09 | 132.4% | 56.7% | 49.3% | N/A | | 1.2% |
| | | | | | | |
| Aliansce IPO | 27-Jan-10 | 134.1% | 53.7% | 41.3% | 91.0% | | 2.8% |
| | | | | | | |
| Sonae IPO | 2-Feb-11 | 62.7% | 21.7% | 36.8% | 31.9% | | 0.3% |
| | | | | | | |
| BRMALLS Follow-on | 10-May-11 | 39.5% | 8.4% | 22.5% | 23.2% | | 3.1% |
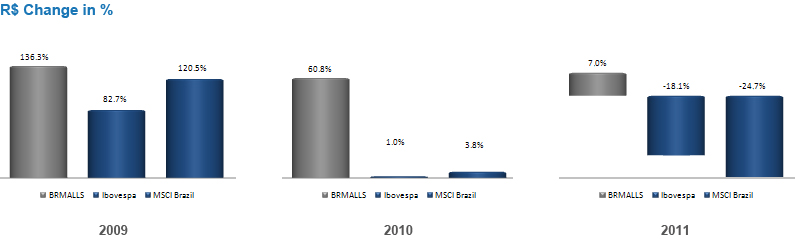
BRMALLS has consistently outperformed Ibovespa and MSCI Brazil:
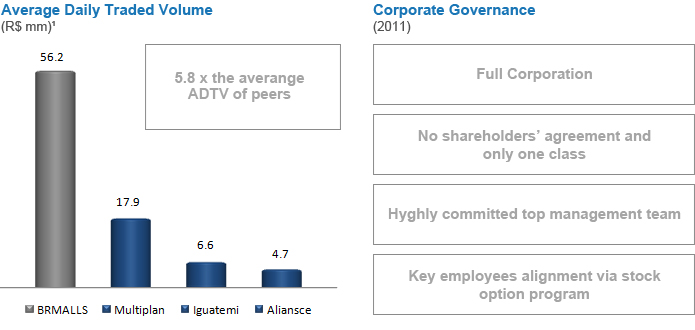
BR MALLS is the company in the sector with the HIGHEST CORPORATE GOVERNANCE STANDARDS and free-float:
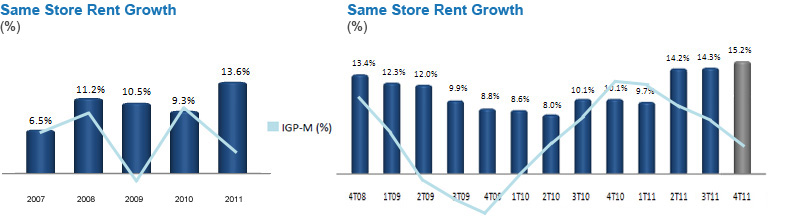
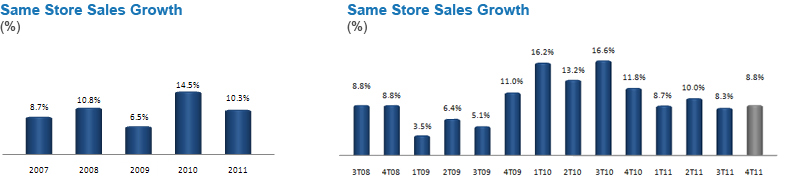
Outstanding performance in a RESILIENT BUSINESS protected against inflation:
Same Store Rent
Same Store Sales
Financial Highlights
Net revenue growth CAGR of 56.7% since 2006, totaling R$864.5 million in 2011. In 4Q11, total rent was responsible for 73.9% of gross revenue. NOI and NOI/m² recorded respective CAGR of 59.9% and 14.5%, reaching R$772.6 million and R$89,000 in 2011. Annual FFO totaled R$331.0 million, with a CAGR of 52.8%, and EBITDA stood at R$684.8 million, with a CAGR of 64.0%.
*Dec/2011